Colloidal Silica Particle Size: How Abrasive Diameter Drives MRR, Selectivity, and Scratch Risk
A rigorous analysis of how D50, D90, and large particle count (LPC) each govern material removal rate, surface roughness, oxide/nitride selectivity, and scratch defect density in colloidal silica CMP—with a practical particle size selection guide for seven key applications.
If there is a single slurry specification that most directly governs the trade-off between productivity and surface quality in colloidal silica CMP, it is particle size. The median particle diameter (D50) controls how fast material is removed; the 90th percentile (D90) influences within-wafer uniformity and micro-roughness; and the large particle count (LPC) above threshold sizes determines the scratch defect density that ultimately limits device yield. Understanding how each of these parameters connects to each process outcome is the foundation for rational slurry selection and process optimization.
1. Particle Size: The Master Variable in CMP
In colloidal silica CMP, every other process variable—pressure, velocity, pH, solids content, pad type—operates within constraints set by the particle size. Change the particle size, and you necessarily change the MRR-defectivity operating point of your process. No amount of process parameter optimization can overcome a fundamentally mismatched particle size selection.
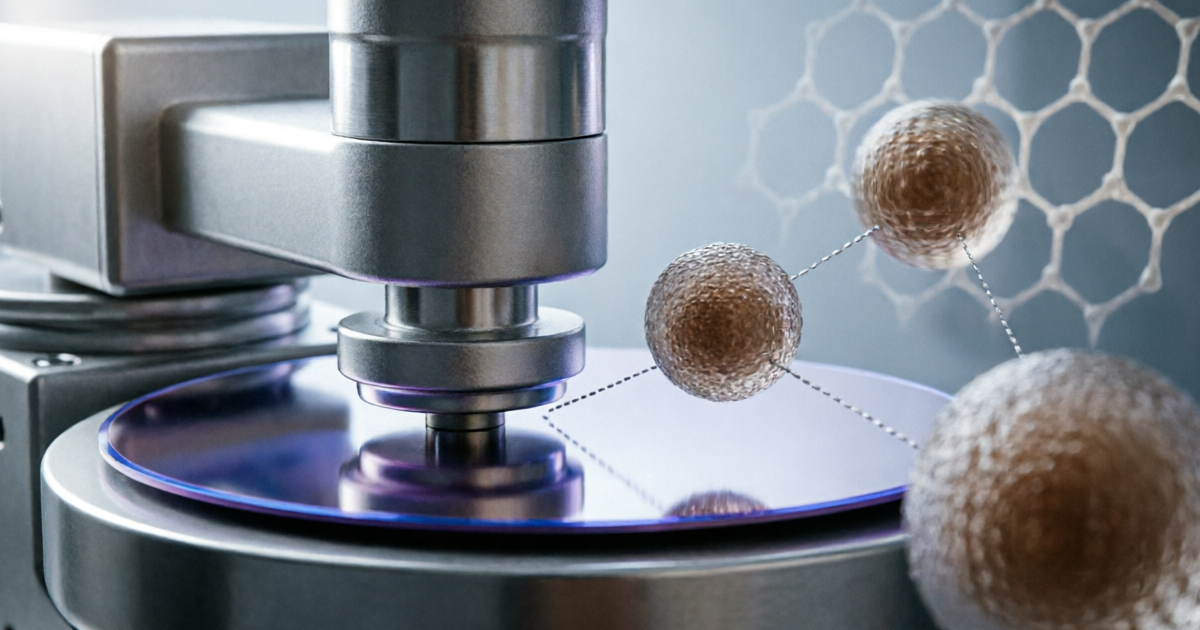
The physics behind this primacy is straightforward: particle size governs the Hertzian contact area between the abrasive and the substrate surface (larger particles → larger contact area → more shear force per particle encounter → higher MRR), and simultaneously governs the peak contact stress produced by particle–substrate interaction (larger particles → higher peak stress at the contact edge → greater probability of plastic deformation → more scratches). These two effects cannot be independently decoupled by changing other process variables—they are both direct consequences of particle geometry.
This is why particle size selection is always the first engineering decision in colloidal silica slurry specification: it sets the fundamental MRR–defectivity operating point, and all subsequent optimization occurs within the window defined by this choice.
2. Key PSD Parameters: D50, D90, and LPC
The particle size distribution (PSD) of a colloidal silica slurry is characterized by multiple statistical parameters, each governing a different aspect of process performance:
2.1 D50 (Median Particle Diameter)
D50 is the diameter at which 50% of the particle volume lies below and 50% above. It is the primary MRR-governing parameter and the standard particle size metric on slurry data sheets. For colloidal silica, D50 is most commonly measured by dynamic light scattering (DLS), which measures the hydrodynamic diameter of particles in suspension based on their Brownian motion diffusion coefficient (Stokes-Einstein relation).
2.2 D90 (90th Percentile)
D90 is the diameter below which 90% of the particle volume lies. The D90/D50 ratio describes the breadth of the size distribution: a D90/D50 ratio of 1.5–2.0 indicates a narrow, well-controlled distribution; a ratio above 2.5 indicates a broad tail that will contain a significant population of particles substantially larger than the median. A broad D90 tail negatively impacts both surface roughness (the largest particles produce the deepest individual removal events, creating roughness spikes) and scratch defectivity (large-tail particles are more likely to cross the scratch threshold).
2.3 Large Particle Count (LPC)
LPC is the concentration of particles above a specific size threshold—typically 0.5 µm and 1.0 µm for semiconductor CMP specifications. It is measured by single-particle optical sensing (SPOS), which uses a laser beam focused on a thin flow channel to detect and size individual particles as they pass through the measurement zone. LPC is the most critical defect-risk parameter in a colloidal silica slurry specification because even a single particle above 1–2 µm can cause a scratch defect spanning millimeters of wafer surface.
LPC is not visible on DLS reports: DLS measures the average scattered intensity from all particles in a volume, weighted toward larger particles but not sensitive to the extreme tail above 0.5 µm. A slurry that appears to have an acceptable D90 by DLS can still have an unacceptable LPC that only SPOS will reveal. Always require SPOS-based LPC data in addition to DLS-based D50/D90 on every slurry CoA.
3. D50 and Material Removal Rate
The relationship between D50 and MRR under constant pressure, velocity, and solids content conditions can be described by a power-law relationship: MRR ∝ D50ⁿ, where n is empirically determined and typically falls in the range 0.5–1.5 depending on the substrate material, pH, and pad type. For SiO₂ CMP with colloidal silica at alkaline pH, n ≈ 0.7–1.0 is commonly observed in controlled experiments, meaning that doubling the D50 from 50 nm to 100 nm increases MRR by approximately 60–100% under otherwise identical conditions.
The mechanistic explanation: larger particles have a larger contact area with the substrate surface (scales as D²), producing greater total shear force per particle contact event and removing a larger surface fragment per event. However, the contact area scaling is partially offset by the lower number density of larger particles at equal solids content (total number of particles per unit volume ∝ D⁻³), so the net MRR scaling with D50 is sublinear.
The practical implication: choosing a larger D50 is an effective lever for increasing MRR without changing pressure or velocity—but it always comes with an MRR–defectivity trade-off that must be explicitly evaluated against the process’s defect budget.
4. Particle Size and Surface Roughness
Surface roughness after colloidal silica CMP depends on particle size through two mechanisms: the individual removal event depth (how much material each particle removes per contact cycle) and the spatial frequency of removal events (how many contact events occur per unit area per unit time).
Smaller particles remove shallower material fragments per event—on the order of 1–3 atomic layers (0.3–0.9 nm) per contact for 20–30 nm particles, versus 3–10 atomic layers for 80–100 nm particles. This directly translates to a smoother surface: for a given total material removal, a finer abrasive produces more, shallower removal events that average to a lower RMS roughness, while a coarser abrasive produces fewer, deeper events that leave a rougher surface.
Empirically, for colloidal silica polishing of silicon at alkaline pH:
- D50 = 20–30 nm → surface roughness 0.05–0.10 nm RMS (final polish spec range)
- D50 = 50–70 nm → surface roughness 0.15–0.30 nm RMS (intermediate polish range)
- D50 = 90–120 nm → surface roughness 0.30–0.60 nm RMS (stock removal / high-MRR oxide CMP)
These values are approximate and depend on pH, pressure, and pad type, but the trend is consistent across published literature and production experience.
5. The Large Particle Tail: Primary Driver of Scratch Defects
While D50 governs MRR and D90 influences roughness, scratch defects are overwhelmingly caused by the large particle tail—the small population of particles above 0.5 µm that exists in every colloidal silica slurry at some concentration, even after filtration.
5.1 Why Large Particles Cause Scratches
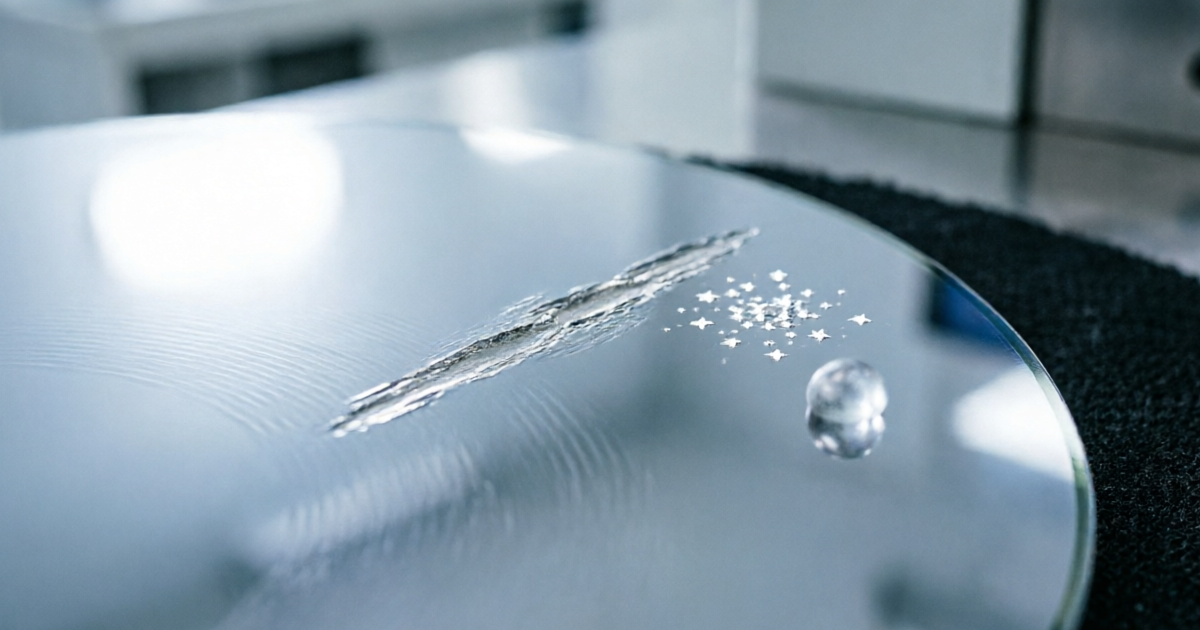
A particle 10–50× larger than the median (e.g., a 1 µm particle in a D50 = 50 nm slurry) is 200–1,000× larger by volume. When this particle is trapped between the pad asperity and the wafer surface, it applies a force 200–1,000× higher than the median particle force at the same nominal CMP process conditions—far exceeding the yield stress of the polished surface, even the harder bulk SiO₂ beneath the hydrated layer. The result is a plastic deformation event that creates a groove (scratch) in the surface that may extend for millimeters as the particle is dragged across the wafer during pad rotation.
5.2 Sources of Large Particles
Large particles in colloidal silica slurry come from three sources:
- Synthesis tail: Even the best-controlled synthesis produces a small number of particles that grow beyond the intended D90 due to statistical fluctuations in the nucleation/growth process
- Agglomeration during storage or dilution: pH excursions (from CO₂ absorption, contamination, or improper dilution water) reduce zeta potential and cause primary particles to agglomerate into clusters that behave as much larger single particles at the polishing interface
- Contamination during handling: Particles from containers, transfer lines, filters, or the polishing tool’s delivery system that are inadvertently introduced into the slurry
5.3 LPC Specification and Control
Best-practice LPC specifications for different CMP applications:
| Application | LPC >0.5 µm (SPOS) | LPC >1.0 µm (SPOS) |
|---|---|---|
| Final silicon polish (prime 300 mm) | <300 counts/mL | <50 counts/mL |
| ILD oxide CMP | <800 counts/mL | <150 counts/mL |
| STI oxide CMP | <2,000 counts/mL | <400 counts/mL |
| Sapphire / glass polish | <1,500 counts/mL | <300 counts/mL |
6. Measurement Methods: DLS vs SPOS vs NTA
| Method | Principle | Measures | Best For | Limitation |
|---|---|---|---|---|
| DLS (Dynamic Light Scattering) | Temporal autocorrelation of scattered laser intensity from Brownian motion | D50, D90 of primary particles; Z-average | Routine D50/D90 QC; fast, non-destructive | Cannot reliably measure LPC >0.5 µm; biased by large particles in mean |
| SPOS (Single Particle Optical Sensing) | Individual particle light obscuration or scattering in flow channel | LPC at thresholds >0.5 µm, >1 µm, >2 µm | LPC specification and verification; defect risk assessment | Does not measure D50; requires high sample volume (2–5 mL) |
| NTA (Nanoparticle Tracking Analysis) | Individual particle Brownian motion tracking by video microscopy | D50, D90, particle concentration; individual particle sizing | Research; validation of DLS results; bimodal distributions | Lower throughput; limited upper size range (~1 µm); requires dilute sample |
| Laser Diffraction (LD) | Angular distribution of scattered laser light from particle ensemble | Volume-weighted PSD including sub-micron range | Coarser abrasives; process ceramics; not recommended for LPC | Severe underestimation of large-particle tail in nanoscale dispersions |
The key recommendation: require both DLS (for D50/D90) and SPOS (for LPC) data on every CoA. Laser diffraction alone is insufficient for CMP-grade colloidal silica specification. NTA is a valuable R&D tool but is not yet standard in production QC due to throughput and cost constraints.
7. Application-Based Particle Size Selection Guide
| Application | Recommended D50 | D90/D50 Target | LPC >0.5 µm | Typical MRR |
|---|---|---|---|---|
| Prime Si final polish | 20–30 nm | ≤2.0 | <300/mL | 100–400 Å/min |
| Epi-ready Si polish | 30–45 nm | ≤2.0 | <500/mL | 200–600 Å/min |
| Cu barrier / Ta CMP | 30–60 nm | ≤2.0 | <600/mL | 300–900 Å/min (Ta) |
| ILD oxide CMP (BEOL) | 50–80 nm | ≤2.2 | <800/mL | 500–1,500 Å/min |
| Sapphire final polish | 50–100 nm | ≤2.2 | <1,500/mL | 50–250 Å/min |
| STI oxide CMP (FEOL) | 80–120 nm | ≤2.5 | <2,000/mL | 1,000–3,500 Å/min |
| Display / optical glass | 80–150 nm | ≤2.5 | <2,000/mL | 200–800 Å/min |
8. How Storage and Dilution Affect Particle Size
Particle size is not a fixed property of a colloidal silica lot—it can change during storage and dilution if conditions deviate from the specified stability window. Two mechanisms cause particle size to increase (never decrease) over time:
- Ostwald ripening: A thermodynamic process where smaller particles slowly dissolve and re-deposit on larger particles, gradually broadening the PSD and increasing D50 and D90. Rate is very slow at ambient temperature and pH 9–12 but accelerates at elevated temperatures (>40°C) or near-neutral pH (7–8).
- Agglomeration: A kinetic process triggered by reduction of zeta potential (from pH excursion, ionic strength increase, or freeze-thaw). Produces clusters of primary particles that appear as dramatically increased LPC and D90 values. Unlike Ostwald ripening, agglomeration can occur rapidly (within hours) if the triggering condition is severe enough.
Practical monitoring recommendation: measure D50, D90, and pH (and ideally LPC) from each delivery lot before use, and compare to CoA values. A D50 increase of >5% or D90 increase of >10% from the CoA value is a flag for investigation before the lot is used at the CMP tool.
9. Frequently Asked Questions
No. DLS D50 data is necessary but not sufficient for CMP qualification. DLS cannot reliably detect or quantify particles above 0.5 µm—the size range responsible for scratch defects. A slurry with an acceptable DLS D50 can still fail LPD specifications if its LPC (measured by SPOS) is elevated due to synthesis tail contamination, agglomeration events, or handling contamination. Always require SPOS-measured LPC data alongside DLS D50/D90 on every CoA, and specify both in your purchase specification.
Under otherwise constant conditions (same pH, pressure, velocity, and solids content), MRR on SiO₂ scales approximately as D50 to the power 0.7–1.0 for colloidal silica at alkaline pH. Practically, doubling D50 from 50 nm to 100 nm increases MRR by 60–100%. This scaling allows particle size to be used as a coarse MRR adjustment lever, but any D50 increase must be evaluated against the defectivity penalty it introduces. For each D50 doubling, expect 3–10× increase in scratch defect density at constant LPC.
The large particle tail refers to the population of particles significantly above the D90—specifically those above 0.5 µm and 1 µm. While D90 describes the breadth of the main distribution, the tail above 0.5 µm represents a completely separate defect risk: these particles are 10–100× larger than the median and produce contact stresses that exceed the yield strength of the polished surface, causing scratch defects. A slurry can have excellent D90/D50 ratio yet still fail LPD specifications if its LPC tail is elevated. This is why SPOS-based LPC is specified separately from DLS-based D90.
Point-of-use filtration (POF) is a complementary control, not a substitute for tight LPC specifications. A 200 nm POF filter will remove particles above ~400–500 nm (depending on filter efficiency), providing significant scratch risk reduction. However: (1) filters introduce their own contamination risk if not properly qualified and replaced on schedule; (2) filters can become saturated rapidly if the incoming LPC is very high, releasing retained particles in a burst; (3) particles generated by in-situ agglomeration after the filter (e.g., from pH excursion in the delivery line) are not captured by a filter installed before the line. The correct strategy is low-LPC slurry specification plus POF as a defense-in-depth measure.
JEEZ Colloidal Silica Slurry: Tight PSD Control Across All Grades
Every JEEZ colloidal silica lot ships with D10/D50/D90 by DLS and LPC by SPOS at >0.5 µm and >1 µm thresholds on the Certificate of Analysis. Request a sample or full technical specification for any of our CS-20, CS-60, or CS-100 series.
Request CoA Sample or Technical Data →Published by Jizhi Electronic Technology Co., Ltd. (JEEZ) · August 2026. For process-specific advice, contact our application engineering team.