CMPスラリーの欠陥:根本原因分析と品質管理-完全なエンジニアリングガイド
In semiconductor manufacturing, a CMP defect is not merely a surface imperfection — it is a direct threat to device yield, reliability, and the tens of thousands of process steps that preceded it. This guide classifies every major CMP slurry-induced defect type, maps each to its slurry-side root cause, defines the incoming QC specifications required to prevent them, and provides the structured root-cause analysis workflow used in advanced fab environments.
目次
- CMP Defect Taxonomy: Slurry-Induced vs. Process-Induced
- Defect 1: Micro-Scratches — Root Causes & Prevention
- Defect 2: Particle Agglomeration & LPC Spikes
- Defect 3: Metal Ion Contamination
- Defect 4: Dishing & Erosion (Slurry-Side Root Causes)
- Defect 5: Surface Corrosion, Pitting & Galvanic Attack
- Defect 6: Residual Slurry Particles & Post-CMP Cleanliness
- Incoming Slurry QC: Specifications & Measurement Methods
- Root Cause Analysis Workflow for CMP Defect Excursions
- Post-CMP Inspection: Tools, Methods & Defect Classification
- よくある質問
1. CMP Defect Taxonomy: Slurry-Induced vs. Process-Induced
Not every CMP defect originates in the slurry. Effective root cause analysis requires first establishing whether the defect has a slurry-side origin or a process/equipment-side origin — a distinction that determines the corrective action and the supplier vs. process ownership boundary. The taxonomy below organizes CMP defects by their primary origin category:
| 欠陥の種類 | Primary Origin | Slurry-Side Factor | Process-Side Factor | Severity |
|---|---|---|---|---|
| マイクロスクラッチ | Slurry & Pad | LPC, hard particles, agglomerates | Pad glazing, conditioner wear, debris | CRITICAL |
| Metal ion contamination | Slurry (primary) | Fe, Na, K, Cu trace metals in slurry | Distribution system leaching | CRITICAL |
| 粒子凝集 | スラリー | pH excursion, temp spike, age | Dilution shock, mixing turbulence | HIGH |
| ディッシング | Process + Slurry | Excess H₂O₂, insufficient BTA | Over-polish, pad hardness, downforce | HIGH |
| 浸食 | Process + Slurry | High SiO₂ MRR in barrier slurry | Pattern density, over-polish | HIGH |
| Surface corrosion / pitting | スラリー | Oxidizer imbalance, inhibitor deficit | Pad stagnation, local pressure | MEDIUM |
| TaN / barrier residue | Process | Low TaN MRR slurry | Insufficient over-polish, WIWNU | HIGH |
| Residual slurry particles | Process (clean) | High abrasive adhesion, large particles | Post-CMP clean chemistry, brush wear | LOW |
| pH excursion damage | スラリー | Out-of-spec pH lot, buffer failure | Mixing ratio error, contamination | HIGH |
| デラミネーション | Process + Slurry | Excess mechanical stress (ULK) | High downforce on fragile film stack | CRITICAL |
📌 The 80/20 Rule of CMP Defects
Industry experience across mature and advanced-node fabs consistently shows that approximately 80% of CMP yield excursions trace to one of three root causes: (1) large particle count (LPC) spikes in the incoming slurry lot, causing micro-scratch events; (2) slurry pH excursions outside the specified window, causing either abrasive agglomeration or film corrosion; and (3) slurry storage/distribution anomalies that degrade the formulation between manufacture and point-of-use. Systematic incoming QC addressing these three categories prevents the majority of slurry-induced yield loss.
2. Defect 1: Micro-Scratches — Root Causes & Prevention
Micro-Scratches
The highest-yield-impact CMP slurry defect; primary driver of killer defect density
Micro-scratches are linear surface defects produced when a single abrasive particle — or a hard agglomerate — is dragged across the wafer surface under the full pad normal force, cutting a groove into the film. They are classified as “killer defects” at advanced nodes because a scratch crossing an active device feature (gate, via, contact) creates a short circuit, open circuit, or reliability failure that cannot be repaired at any downstream process step. Unlike most CMP defects, which can be modeled statistically and partially corrected by process adjustment, a killer scratch is a permanent, discrete yield loss event.
Root Cause Categories
1. Large particle count (LPC) in slurry. The single highest-probability root cause. Colloidal slurries have a designed D50 of 30–80 nm, but every lot contains a statistical tail of larger particles. Particles above 200–500 nm — classified as “large particles” in LPC measurement — carry dramatically elevated scratch risk because the contact force per abrasive particle scales as approximately F ≅ d² (particle diameter squared). A single 500 nm particle thus carries ~40× the contact force of a 80 nm design particle, producing a groove that in silicon or low-k dielectric can easily exceed 50 nm depth — deep enough to fail an EUV print step or short a sub-10 nm interconnect.
2. Abrasive agglomeration events. Colloidal stability can be disrupted by pH excursion, temperature spikes, ionic contamination, or simply slurry age beyond shelf life. When colloidal silica or ceria particles agglomerate, they form clusters of 200–2,000 nm — effectively “giant particles” from a scratch-risk perspective — that are not removed by standard 200 nm POU filtration designed for single-particle removal. Agglomeration can occur in the bulk slurry container, in the distribution loop, or in the POU mixing zone if two-part slurry components are not mixed at controlled conditions.
3. Pad debris and conditioner contamination. Not all scratches originate in the slurry. Diamond conditioner disc shed (broken or worn diamond abrasives falling into the slurry-pad interface) and pad debris from pad wear or groove edge fracture can produce scratches indistinguishable from slurry-origin scratches by post-CMP defect inspection morphology. Differentiating slurry-origin from equipment-origin scratches requires correlation of scratch azimuthal orientation with wafer-carrier rotation direction — slurry-origin scratches tend to be random in orientation, while conditioner-shed scratches tend to cluster in specific azimuthal bands.
Scratch Prevention Hierarchy
- Incoming LPC specification enforcement: LPC (>0.5 μm) ≤50/mL is the standard advanced-node incoming spec. Some fabs impose LPC (>0.2 μm) ≤200/mL as an additional early-warning criterion for sub-5nm applications.
- Point-of-use (POU) filtration: 100–200 nm absolute POU filters installed immediately before the dispense arm remove agglomerates that form during distribution even if the bulk lot passes incoming LPC. Filter integrity monitoring (differential pressure, flow rate) is critical — a saturated POU filter can itself shed captured agglomerates back into the slurry stream. Full guidance on POU filter selection is in our CMPスラリーフィルター、保管とハンドリング の記事を参照されたい。.
- Slurry age management: Define and enforce point-of-use slurry age limits based on stability data. Most commercial CMP slurries have a POU stability window of 8–24 hours after mixing/dilution. After this window, LPC typically increases as colloidal stability degrades.
- Conditioner disc inspection cadence: Implement SEM inspection of conditioner disc diamond retention at defined PM intervals. Replace discs at first evidence of diamond pull-out before shed becomes a production yield risk.
3. Defect 2: Particle Agglomeration & LPC Spikes
Particle Agglomeration & LPC Spikes
The precursor to micro-scratches; detectable before wafer contact damage occurs
Colloidal stability — the state in which individual abrasive particles remain individually dispersed without clustering — is maintained by electrostatic repulsion between particles. The colloidal particle's zeta potential (ζ) quantifies this repulsion: a magnitude of |ζ| >30 mV provides adequate stability for most CMP slurries, and |ζ| >40 mV is the target for slurries used in high-defectivity-sensitivity applications. When the electrostatic barrier is reduced below the critical threshold, van der Waals attractive forces dominate and particles begin to cluster — agglomeration.
Agglomeration Trigger Mechanisms
- pH excursion: The zeta potential of colloidal silica peaks at approximately pH 9.5–10.5. At its isoelectric point (IEP, pH ≈ 2–3 for silica), zeta potential approaches zero and agglomeration is instantaneous and irreversible. Even a modest pH drop from 10.0 to 8.5 can reduce zeta potential by 30–40%, materially increasing agglomeration risk over the distribution residence time.
- Divalent cation contamination: Ca²⁺ and Mg²⁺ ions — introduced from non-ultrapure water, incompatible distribution materials, or biocide breakdown — neutralize the negative surface charge on silica particles at concentrations as low as 1–5 ppm, collapsing the electrostatic barrier and triggering rapid agglomeration. This is one of the most insidious agglomeration failure modes because the slurry may pass visual appearance checks and bulk pH measurement while containing elevated LPC that will produce scratches on the first wafer contacted.
- Temperature excursion: Elevated temperature (>30°C) increases Brownian motion energy, giving particles the kinetic energy to overcome residual electrostatic barriers. Temperature excursions also accelerate H₂O₂ decomposition in Cu CMP slurry, changing both the oxidizer activity and the pH — creating a compound agglomeration risk.
- Two-part mixing turbulence: Many modern CMP slurries are delivered as two-part systems (abrasive concentrate + chemical additive package) mixed at point-of-use. Incorrect mixing ratio, excessive mixing speed, or mixing of incompatible pH streams can create a transient agglomeration event that persists for hours in the distribution loop.
⚠️ Zeta Potential: The Early Warning Indicator
Zeta potential measurement (Malvern Zetasizer or equivalent) on each incoming lot provides a leading indicator of colloidal stability risk that LPC measurement alone cannot deliver. A lot with nominal LPC but a zeta potential trending from −45 mV (historical baseline) toward −30 mV should trigger a hold and investigation before the lot reaches the production tool — even if the LPC still passes its acceptance criterion, because the reduced stability reserve means LPC can spike rapidly during distribution.
4. Defect 3: Metal Ion Contamination
5. Defect 4: Dishing & Erosion — Slurry-Side Root Causes
Dishing & Erosion
RC delay killers in copper interconnect — the slurry-side levers for control
Dishing and erosion in copper CMP are covered extensively in the process-level context in our 銅CMPスラリー guide. This section focuses specifically on the slurry-side parameters that are the primary levers for dishing and erosion control, distinct from the process/equipment levers (pad hardness, downforce, over-polish time).
Slurry Parameters Driving Dishing
- H₂O₂ concentration in Step 2 slurry: Each additional 0.1 wt% of H₂O₂ above the optimum in barrier slurry increases chemical dissolution of copper in recessed features by approximately 3–5 nm of additional dishing, independent of mechanical polishing. This relationship makes H₂O₂ assay precision (±3% relative target) one of the most critical incoming QC parameters for dishing control.
- BTA concentration: Insufficient BTA in barrier slurry is the single most directly slurry-controllable dishing driver. BTA acts as a selective corrosion inhibitor in copper recessed areas — its concentration must be held within a narrow optimal window (typically 50–200 ppm) where it suppresses chemical dishing without over-inhibiting the targeted mechanical removal rate.
- pH of barrier slurry: pH determines both the H₂O₂ oxidation rate and the BTA adsorption strength onto copper surfaces. pH values above the optimal range reduce BTA adsorption efficiency, increasing dishing even at adequate BTA concentration.
Slurry Parameters Driving Erosion
- SiO₂ / dielectric MRR in barrier slurry: Erosion in dense copper array areas is driven by excessive dielectric removal rate relative to copper removal rate in Step 2 slurry. The SiO₂:Cu selectivity of the barrier slurry must be tuned close to 1:1; barrier slurries with SiO₂:Cu >1.5:1 systematically produce erosion exceedance at pattern densities above 40%.
- Abrasive particle size in barrier slurry: Larger abrasive particles in Step 2 slurry increase the dielectric MRR disproportionately relative to copper MRR, because the larger contact area with the softer dielectric generates higher removal rates than with the harder copper surface. Controlling D99 in barrier slurry is therefore directly linked to erosion performance.
6. Defect 5: Surface Corrosion, Pitting & Galvanic Attack
Surface Corrosion, Pitting & Galvanic Attack
Chemical dissolution without mechanical contact — the “static etch” failure mode
Surface corrosion and pitting occur when the slurry chemistry produces net chemical dissolution of a metal film even in the absence of abrasive mechanical contact — effectively a wet etch of the target or surrounding metal features. This is distinct from the controlled, intentional chemical component of the synergistic CMP mechanism; corrosion is uncontrolled chemical removal that continues after the polishing step ends (during slurry puddle time, rinse delays, or inadequate endpoint detection).
Galvanic Corrosion at Metal Interfaces
When two different metals are in electrical contact in the presence of an aqueous electrolyte, a galvanic cell forms and the more anodic metal corrodes preferentially. In semiconductor CMP, the most significant galvanic pairs are:
- Cu / TaN at Step 2 barrier CMP: Cu (more anodic in alkaline conditions) preferentially dissolves at the Cu/TaN interface, producing preferential pitting at via sidewalls and contact edges — exactly the highest-resistance-sensitivity locations in the interconnect.
- Co / TiN at MOL contact CMP: Cobalt is more anodic than TiN across a wide pH range, driving preferential Co dissolution and microscopic pitting at the Co/TiN contact perimeter — the root cause of the galvanic corrosion challenge in cobalt CMP that is discussed in detail in our アドバンスド・ノードCMP の記事を参照されたい。.
- W / Ti at tungsten contact CMP: Tungsten is slightly anodic relative to Ti liner in the acidic slurry environment, producing micro-pitting at W/Ti interfaces if the slurry Fe(NO₃)₃ oxidizer concentration is not precisely controlled.
Prevention: Inhibitor and Oxidizer Balance
Corrosion prevention requires co-optimization of the oxidizer (providing the controlled oxidation needed for CMP removal) and the inhibitor (suppressing uncontrolled dissolution in areas not under abrasive contact). The key control parameters are: oxidizer concentration lot-to-lot precision (±3% relative); inhibitor concentration (BTA for Cu, benzimidazole derivatives for Co); pH control (±0.1 target at advanced nodes); and minimizing the “static etch time” during which slurry contacts the wafer surface without pad motion — a critical process protocol requirement that must be controlled independently of slurry chemistry.
7. Defect 6: Residual Slurry Particles & Post-CMP Cleanliness
Residual Slurry Particles
Post-CMP cleanliness — the interface between slurry chemistry and clean module performance
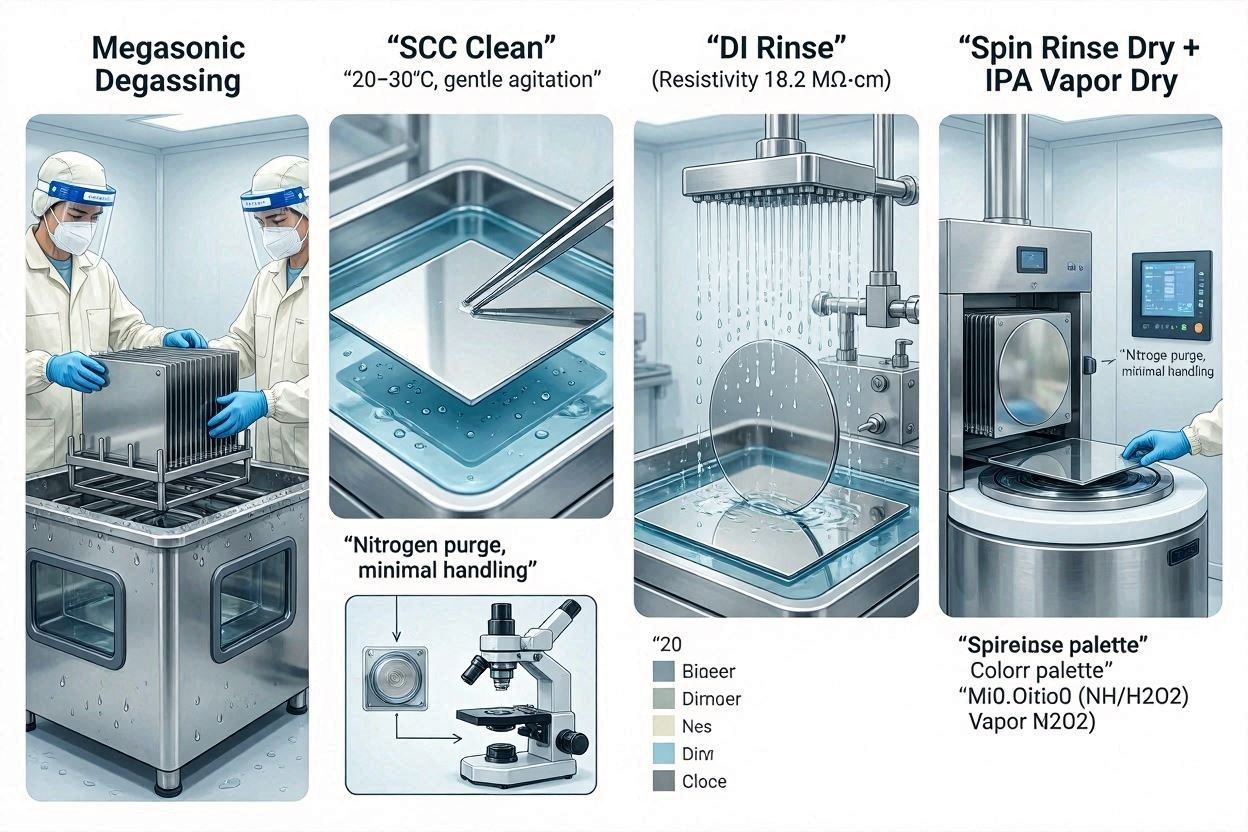
After CMP, the wafer surface is covered with a film of slurry containing abrasive particles, dissolved metal ions, reaction byproducts, and chemical additives. Post-CMP clean (typically PVA brush scrub with dilute NH₄OH solution + megasonic agitation) must remove all of these residues to below the incoming inspection threshold of the next process step. The cleanliness of the post-CMP surface is a joint function of the slurry chemistry and the clean module chemistry — neither can be independently optimized in isolation.
The slurry-side parameters most affecting post-CMP cleanability are: abrasive surface charge (anionic silica is more easily removed from the also-negative wafer surface by electrostatic repulsion in alkaline clean chemistry than cationic abrasives, which electrostatically adhere to negative surfaces); particle size (larger residual particles adhere more strongly through van der Waals forces and require more aggressive clean chemistry or brush contact force to remove); and BTA residue in copper CMP (the hydrophobic Cu–BTA complex layer on post-CMP copper surfaces requires specific clean chemistry containing dilute HCl or citric acid to disrupt the complex and enable BTA removal).
8. Incoming Slurry QC: Specifications & Measurement Methods
Incoming QC is the first and most cost-effective barrier against slurry-induced defect excursions. The table below defines a comprehensive incoming QC specification framework for advanced-node CMP slurry, with the measurement method, equipment, and the defect risk each parameter guards against.
✅ Statistical Process Control for Incoming Slurry QC
Advanced-node fabs implement SPC on incoming slurry QC data — not just pass/fail binary acceptance. Tracking the rolling mean and ±3σ control limits for LPC, zeta potential, pH, and H₂O₂ assay on a lot-by-lot chart enables detection of gradual drift (indicating a supplier process change) weeks before an individual lot triggers a hard specification failure. Control chart rules (Nelson rules or Western Electric rules) applied to the QC data stream provide earlier defect prevention than specification-only acceptance.
9. Root Cause Analysis Workflow for CMP Defect Excursions
Experiencing a CMP Defect Excursion?
Jizhi Electronic Technology's application engineering team provides defect root cause analysis support for slurry qualification and production excursion investigation at your facility.
Request Engineering Support →When a CMP defect excursion is detected by post-CMP inspection — a sudden increase in scratch count, an LPD spike on the defect map, or a dishing/erosion exceedance — the structured root cause analysis (RCA) workflow below provides the most efficient path to identifying the corrective action and preventing recurrence.
10. Post-CMP Inspection: Tools, Methods & Defect Classification
Post-CMP inspection is the detection layer that catches defects before they propagate to downstream process steps. The choice of inspection tool, scan recipe, and defect classification scheme directly determines what fraction of CMP-induced yield loss is detected and actionable vs. escaping to the final test.
| Inspection Method | Tool Examples | Detectable Defects | Min. Detectable Size | Best For |
|---|---|---|---|---|
| Dark-field laser scattering (brightfield + oblique) | KLA SP7, Hitachi LS9500, AMAT Puma 9500 | Scratches, particles, pits, voids | ~20 nm (at highest sensitivity mode) | High-throughput 300mm production inspection; scratch and LPD maps |
| SEM-based review (ADR) | KLA eDR-7xxx, Hitachi RS-6000 | Scratch morphology, particle type, pit depth, contamination identification | 3–5 nm (SEM resolution) | Defect classification, RCA after optical detection; not production inline |
| Atomic Force Microscopy (AFM) | Bruker Dimension, KLA SurfscanPro | Dishing, erosion, surface roughness, sub-5nm scratches | Sub-nm height resolution | Dishing/erosion metrology; final polish surface quality (EUV blanks, hybrid bonding) |
| Scatterometry / OCD | KLA Aleris, Onto Nova | Dishing and erosion in patterned array (indirect) | Pattern-level (statistical) | Inline dishing/erosion monitoring on production patterns without destructive test |
| ICP-MS surface analysis | Agilent 7900 ICP-MS + VPD (vapor phase decomposition) | Metal ion contamination on wafer surface | <10⁹ atoms/cm² (10³ atoms/cm² for Fe) | Metal contamination qualification; not routine inline (destructive sample prep) |
| Ellipsometry | KLA ASET-F5x, Woollam M-2000 | Remaining film thickness after CMP; WIWNU measurement | ±1 nm thickness | MRR uniformity (WIWNU) monitoring; endpoint validation |
🔮 Defect Classification: Connecting Morphology to Root Cause
Effective SEM-based defect classification enables direct mapping from defect morphology to root cause hypothesis: Single linear scratch (V-profile, length >5 μm) → single hard particle or agglomerate event; Multiple parallel scratches (same azimuth) → conditioner disc shed or pad debris dragged across wafer; Circular pit array (⌀ 50–200 nm, random distribution) → surface corrosion / galvanic pitting; TaN islands on dielectric (EDX confirmed) → insufficient Step 2 over-polish or WIWNU of Step 2 slurry; Haze / micro-roughness (no discrete defects) → pH excursion causing surface dissolution.
11.よくある質問
What is the most common cause of micro-scratches in CMP slurry?
How does slurry pH affect CMP defectivity?
What is the LPC specification for advanced node CMP slurry?
How is metal ion contamination from CMP slurry detected?
What is zeta potential and why does it matter for CMP slurry quality?
結論
CMP slurry defect control is ultimately a systems problem — spanning slurry manufacture, distribution, incoming QC, process integration, and post-CMP inspection, with each link in the chain capable of introducing or preventing yield loss. The defects covered in this guide — micro-scratches, particle agglomeration, metal contamination, dishing, erosion, and galvanic corrosion — are all preventable through disciplined, specification-driven incoming QC combined with point-of-use monitoring and structured RCA when excursions occur.
For the specific slurry chemistry context behind each defect type, revisit our articles on 銅CMPスラリー そして 先進ノード用CMPスラリー. For the slurry handling and storage practices that prevent distribution-induced quality degradation between manufacture and point-of-use, see our guide on CMPスラリーフィルター、保管とハンドリング. For the complete foundational overview, return to the CMPスラリーガイド.