Kerf Width Variation in Wafer Dicing Root Causes and Control Methods
← Back to: Diamond Dicing Blades: The Complete Guide
Kerf width — the width of material removed by the dicing blade — is one of the most important dimensional output variables in wafer dicing. Excessive kerf consumes street width that could have been used for die area; insufficient kerf may indicate blade wear that predicts imminent chipping escalation; and kerf variation across a wafer signals process instability that undermines die placement accuracy and downstream assembly yield. This guide identifies every major root cause of kerf width variation and provides a practical framework for controlling it in production.
1. Kerf Width Fundamentals
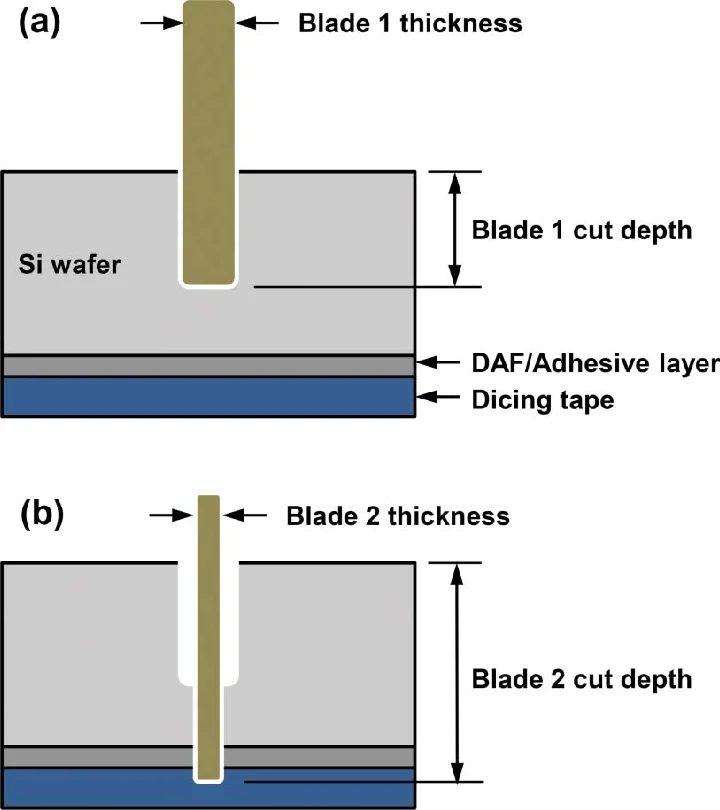
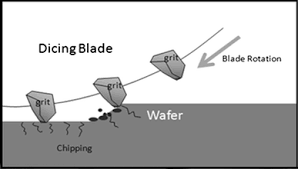
The kerf is always wider than the nominal blade thickness. Diamond grains protrude laterally beyond the blade face — the protrusion distance is a function of grit size, bond hardness, and the degree of diamond exposure. Additionally, spindle runout causes the blade to oscillate laterally during rotation, widening the effective cutting path. The relationship is approximately:
Diamond lateral protrusion is typically 5–15 µm per side for standard grit sizes. TIR (total indicated runout) adds equally on both sides of the kerf.
In practice, kerf width is characterised empirically during process qualification by measuring actual cut width on scrap material across multiple positions, and the result is used as the process reference value. Any deviation from this reference in production is the quantity that must be diagnosed and controlled.
2. Why Kerf Variation Matters
Kerf width variation has three distinct yield and quality implications:
- Die size accuracy: Each street cut removes material from two adjacent die edges. If kerf width is wider than designed, the die is smaller than the layout specifies — which can affect device electrical performance on designs with tight perimeter structures, and can cause pick-and-place misalignment if the die size falls outside the pick-up tool’s calibrated range.
- Street integrity: For very narrow streets (50–100 µm), an increase of even 10–15 µm in kerf width begins to encroach on the die edge exclusion zones, creating a risk that metal routing or test pad structures near the street edge are damaged by the cut.
- Blade condition indicator: Kerf width trends are a leading indicator of blade condition. A narrowing kerf indicates reduced diamond protrusion from wear or glazing — a widening kerf can indicate runout increase from flange wear. Both trends provide actionable process control information before chipping or dimensional excursions occur.
3. Root Causes of Kerf Width Variation
Spindle Runout (TIR)
Runout is the largest contributor to kerf width in most production processes. As TIR increases — due to flange wear, contamination, or spindle bearing degradation — the kerf widens correspondingly. An increase in TIR of 2 µm adds approximately 4 µm to the kerf width (2 µm per side). On a 50 µm street with a 30 µm design kerf, a TIR increase from 1 µm to 5 µm produces an 8 µm kerf increase — consuming 16% of the available exclusion zone on each side.
Runout increase is also asymmetric in its cause: one side of the kerf may be worse than the other if the runout is due to a localised contamination or wear spot on the flange rather than a centred shaft displacement.
Blade Wear and Changing Diamond Protrusion
As a blade wears through its service life, the OD decreases and diamond grains in the active cutting zone are consumed and shed. The remaining diamond grains at any point in the blade’s life may protrude more or less than grains at the start of life, depending on how the bond matrix is wearing relative to the grain tops. Generally, a fresh-dressed blade has maximum diamond protrusion and the widest kerf; a blade approaching end of life with reduced diamond density has narrower protrusion and a narrower kerf. Tracking kerf width trend over blade life enables end-of-life prediction.
Blade Loading and Glazing
A loaded blade has diamond grains partially buried in debris — reducing effective lateral protrusion and narrowing the kerf. A glazed blade has polished, low-profile grains with reduced protrusion — also narrowing the kerf. In both cases, kerf narrowing is accompanied by increasing chipping as cutting forces escalate. A kerf width that narrows by more than 5–8 µm from the process baseline is a reliable early warning indicator that loading or glazing has begun. See the companion articles on blade loading 和 chipping for the full diagnostic framework.
Thermal Expansion During Warm-Up
As the spindle warms from ambient to operating temperature, the shaft undergoes thermal expansion that shifts the blade position axially and can alter the effective runout. Kerf width measurements taken before spindle thermal equilibrium is reached will be inconsistent and should not be used as production reference values. Always allow a 5–10 minute warm-up before making any kerf reference measurements.
Blade Thickness Lot-to-Lot Variation
Dicing blades are manufactured with a tolerance on nominal thickness — typically ±0.003 to ±0.005 mm depending on specification. A blade at the upper end of its thickness tolerance will produce a wider kerf than one at the lower end, even if both are within the blade specification. When kerf width shifts between blade lots with no other process change, incoming blade thickness variation is the most likely cause. Measure incoming blade thickness with a calibrated micrometer and record results as part of blade receipt inspection.
Wafer Flatness Variation (TTV)
On wafers with significant total thickness variation (TTV), the cut depth changes across the wafer surface. Where the wafer is thicker, the blade spends more time in the material per unit lateral travel; where thinner, less time. This affects the thermal and force balance at the cutting zone differently across the wafer, which can produce small but systematic kerf width variations that correlate with the wafer TTV map. This effect is most significant on thinned wafers (below 150 µm) where TTV is proportionally larger relative to wafer thickness.
4. Within-Wafer Kerf Variation vs Wafer-to-Wafer Variation
| Variation Type | Pattern | Most Likely Root Cause |
|---|---|---|
| Within-wafer, systematic (centre-to-edge) | Kerf wider at wafer edge than centre, or vice versa | Wafer TTV; thermal gradient across wafer during cutting |
| Within-wafer, positional (along a single street) | Kerf wider at entry or exit of street | Spindle vibration at entry; lateral deflection at exit; warm-up drift |
| Within-wafer, random | No spatial pattern; kerf varies unpredictably | Tape adhesion variation; chuck contamination; intermittent coolant blockage |
| Wafer-to-wafer, gradual trend | Kerf narrowing progressively across a blade’s service life | Normal blade wear; progressive glazing |
| Wafer-to-wafer, step change | Kerf suddenly wider or narrower after a specific event | Blade change (new lot); flange change or cleaning; parameter change |
| Lot-to-lot, consistent offset | All wafers in a new blade lot run slightly wider or narrower | Blade thickness lot-to-lot variation; different grit lot |
5. Measurement Methods and Sampling Strategy
Kerf width is measured by optical microscopy at 200× or higher magnification, using the dicing saw’s built-in vision system or a separate inspection microscope. The kerf width is taken as the distance between the two inner edges of the cut at the wafer surface (for FSC measurement) or at the tape surface (for BSC measurement).
A practical production sampling strategy:
- Measure kerf width at three positions per wafer: one near the wafer centre, one at mid-radius, and one near the wafer edge. This captures within-wafer spatial variation.
- Measure on both X and Y street directions to detect any directional asymmetry caused by crystallographic effects or feed-direction-specific blade deflection.
- Sample at the frequency defined by the control plan — typically every wafer during qualification, every 5th wafer during production monitoring.
- Record measurements with blade ID and metres-cut value so that kerf width trend over blade service life can be tracked as an end-of-life indicator.
6. SPC Framework for Kerf Width Control
Kerf width is an ideal SPC variable because it is measurable at high frequency, responds predictably to process inputs, and provides leading-indicator information on blade condition. A practical SPC implementation:
- Establish the process mean and natural variation during process qualification across at least three blade lots and 30+ wafers. Calculate the mean kerf width and standard deviation (σ).
- Set control limits: Warning limit at mean ±2σ; action limit at mean ±3σ.
- Define responses: Warning limit crossed → inspect blade condition and flange; increase sampling frequency. Action limit crossed → stop production; perform full diagnostic per the root cause framework above.
- Track trends, not just points: Six or more consecutive measurements trending in one direction (all increasing or all decreasing) is a control rule violation even if no individual point exceeds the action limit. A narrowing trend indicates developing glazing or loading; action before the action limit is crossed prevents yield excursions.
7. Corrective Action by Root Cause
| Root Cause | Corrective Action | Verification |
|---|---|---|
| Spindle TIR elevated | Clean and inspect flanges; replace worn flanges; check spindle bearing TIR | Measure TIR before and after; confirm kerf width returns to baseline |
| Blade wear / reduced diamond protrusion | Dress blade; if near end-of-life, replace | Kerf width measurement after dress; compare to new-blade baseline |
| Blade loading or glazing | Dress blade; address root cause (coolant, bond type) | Kerf width and chipping both return to baseline after dress |
| Spindle warm-up incomplete | Enforce 5–10 min warm-up before reference measurements | Kerf width stability over time after warm-up period |
| Blade lot thickness variation | Add incoming thickness measurement to blade receipt inspection; return out-of-spec lots | Measure 3–5 blades per incoming lot with calibrated micrometer |
| Wafer TTV | Improve upstream grinding uniformity; use TTV-controlled wafer lots | Correlate kerf width spatial map with wafer TTV map |
Need Help Controlling Kerf Width in Your Process?
Jizhi Electronic Technology supplies dicing blades with tight thickness tolerances and consistent grit specifications, reducing lot-to-lot kerf width variation at the source. Contact our team for blade qualification support.
Request Process Support View Dicing Blades常见问题
↩ Return to the full guide: Diamond Dicing Blades — The Complete Guide