Post-CMP Defect Analysis: Scratches, LPC & Inspection Methods
A practical guide to understanding, characterizing, and eliminating the most common post-CMP defect types — covering scratch morphology, large particle contamination, inspection equipment selection, and root cause analysis methods linked to slurry variables.
Post-CMP defects are among the highest-impact yield detractors in semiconductor manufacturing. Unlike random particle contamination, which affects isolated die, CMP scratch defects frequently propagate across many adjacent structures in long linear tracks — creating correlated yield loss patterns that are disproportionately damaging relative to the defect count. A single CMP scratch event at an early process level can propagate killer defects to every subsequent layer deposited over it, multiplying the yield impact with each step.
Understanding the root causes of post-CMP defects — particularly their relationship to slurry formulation variables — is the foundation for systematic defect reduction. This guide covers the major defect types, inspection methodologies, root cause analysis approaches, and the specific slurry properties that most strongly influence defect outcomes. For background on CMP slurry composition and process mechanics, see: What Is CMP Slurry? A Complete Guide.
1. Why Post-CMP Defectivity Is a Yield-Critical Issue
The economic significance of post-CMP defects is easily underestimated when viewed purely as a count-per-wafer metric. A 300 mm wafer at an advanced node may contain tens of billions of transistors across hundreds of die. A single scratch that is 50 µm long and crosses several metal lines will kill every die it touches — potentially 5–20 die on a modern dense design. At wafer values of $10,000–$50,000 or more after significant processing investment, the per-defect cost impact is extremely high.
This economic reality explains why CMP slurry specifications typically include defect metrics — LPC limits, scratch counts — alongside removal rate and uniformity specifications. It also explains why process engineers are often willing to accept a higher-cost slurry that consistently delivers 50% lower defect density: the yield improvement value can exceed the cost premium by an order of magnitude.
Key principle: Post-CMP defect density is not primarily a cleanliness problem — it is a slurry quality problem. The majority of yield-killing CMP defects originate from either oversized abrasive particles (LPC) already present in the slurry, or agglomerates formed in the slurry distribution system. Post-CMP cleaning can remove residual particles, but it cannot undo the mechanical damage caused by a scratch that occurred during polishing.
2. Major Post-CMP Defect Types
Linear mechanical damage tracks, typically >10 µm long, visible under bright-field inspection at low magnification. Usually caused by hard agglomerates or oversized abrasive particles. Cross multiple die boundaries and cause high correlated yield loss.
Short, shallow scratches (<5 µm) visible only at high magnification or by SEM. Can still cause metal line opens or shorts if they cross conductors. Typically caused by borderline-oversized abrasive particles or pad asperity stress concentrations.
Abrasive particles or slurry agglomerates that remain on the wafer surface after post-CMP cleaning. Can cause particle defects in subsequent lithography, deposition, or etch steps. Alumina residues are particularly difficult to clean due to electrostatic adhesion.
Dissolved metal ions (Cu, Fe, Ce, Al) from slurry components adsorbing onto post-CMP surfaces. Particularly harmful near gate oxide areas (metal-induced gap states, MOSFET threshold shift). Controlled by chelating agents and post-CMP cleaning chemistry.
Localized material removal significantly deeper than the surrounding polished surface. Can result from localized corrosion (copper pitting), over-polish in low-pattern-density areas, or chemical attack from slurry at points of incomplete surface passivation.
Diffuse surface discoloration or increased light scattering without discrete particle features. Typically caused by incomplete rinsing, chemical residues from slurry additives, or reaction products between slurry components and the film surface. Usually removable by optimized post-CMP cleaning.
3. Scratch Defects: Morphology and Root Causes
Scratch morphology carries important diagnostic information about root cause. Learning to read scratch patterns accelerates root cause analysis and speeds defect reduction efforts:
Long, Straight Scratches (Linear Trajectory)
Linear scratches that follow consistent direction across the wafer, often in arcs corresponding to the carrier head rotation, indicate a persistent hard particle trapped between the pad and the wafer — typically a slurry agglomerate or a fragment of pad conditioner diamond that has detached and embedded in the pad. These scratches are among the most yield-damaging because of their length and because the underlying particle often creates multiple parallel scratches in a single pass.
Short, Curved or Random Scratches
Short scratches with curved trajectories or random orientation typically indicate episodic large particle events — a slurry agglomerate that causes one or a few impacts before being swept away or breaking up. These are associated with LPC excursions in the slurry and are most frequently observed after slurry lot changes, distribution system upsets, or point-of-use filter breaches.
Shallow, High-Density Micro-Scratch Fields
A high density of very short, very shallow scratches uniformly distributed across the wafer, visible only by SEM or advanced bright-field inspection, typically indicates an abrasive particle size distribution that is too coarse — where the D90 or D99 of the particle size distribution is too large even if the mean (D50) is within specification. This defect type is often slurry-specific and responds to switching to a finer-distribution abrasive.
Common misdiagnosis: Scratches attributed to “pad conditioning” are more frequently caused by oversized abrasive particles or agglomerates in the slurry. Before adjusting conditioner parameters, confirm the LPC level of the incoming slurry lot and verify that the point-of-use filter is intact and within its specified replacement interval. Slurry causes are more common and easier to address than pad-related causes.
4. Large Particle Count (LPC): Measurement and Control
Large Particle Count (LPC) — typically measured as the concentration of particles above a threshold diameter of 0.5 µm or 1.0 µm in the slurry — is the single slurry quality metric most directly correlated with in-process scratch defect rate. Even a single excursion to 500+ particles/mL at >1 µm (vs. a normal specification of <50 particles/mL) can cause a scratch excursion event visible on KLA inspection maps.
LPC Sources in CMP Slurry Systems
- Slurry lot quality: Inadequate dispersion or filtration during manufacturing. This is a supplier quality management issue and is controlled by incoming inspection CoA review and occasional independent re-measurement.
- Distribution system agglomeration: Temperature gradients, mechanical shock from pump action, long residence time in static distribution legs, and material incompatibility between slurry chemistry and distribution system materials (gaskets, tubing, fittings) can all trigger particle agglomeration in the dispensing system between the bulk container and the tool.
- Point-of-use filter failure: POU filters at the tool are the last line of defense against LPC reaching the wafer. Filter bypass (seal failure), filter breakthrough (overly aggressive chemistry dissolving the filter membrane), or extended filter life beyond rated capacity all eliminate this protection.
- Slurry age and temperature excursion: Slurry held at elevated temperature (>30°C) or near-freezing (<5°C) often shows accelerated agglomeration. Most slurries specify storage at 15–25°C; excursions outside this window should be flagged and lots re-inspected before use.
LPC Measurement Methods
| Method | Principle | Threshold Size | Strengths | Limitations |
|---|---|---|---|---|
| Light Obscuration (HIAC) | Particle blocks laser beam; pulse height = size | 0.5–1 µm | Fast, production-standard, absolute count | Sensitive to bubbles; dilution required for concentrated slurries |
| Laser Diffraction (Malvern) | Diffraction pattern from ensemble of particles | ~100 nm | Full PSD; good for D50, D90 | Poor sensitivity for large particle tail; not an absolute count |
| Dynamic Light Scattering (DLS) | Brownian motion velocity → size (Stokes-Einstein) | 1–500 nm | Very small particle sizes; easy to run | Biased toward small particles; poor for bimodal distributions |
| Nanoparticle Tracking (NTA) | Tracks individual particle motion by video | 50–1,000 nm | Individual particle detection; concentration & size simultaneously | Limited concentration range; slow throughput |
Measurement standardization: LPC measured by light obscuration (HIAC) and by laser diffraction will give very different results for the same sample because they measure fundamentally different properties of the particle population. Always specify both the method and the threshold size when setting LPC limits in your incoming inspection specification. Comparing CoA data from different suppliers measured by different methods is not meaningful without method normalization.
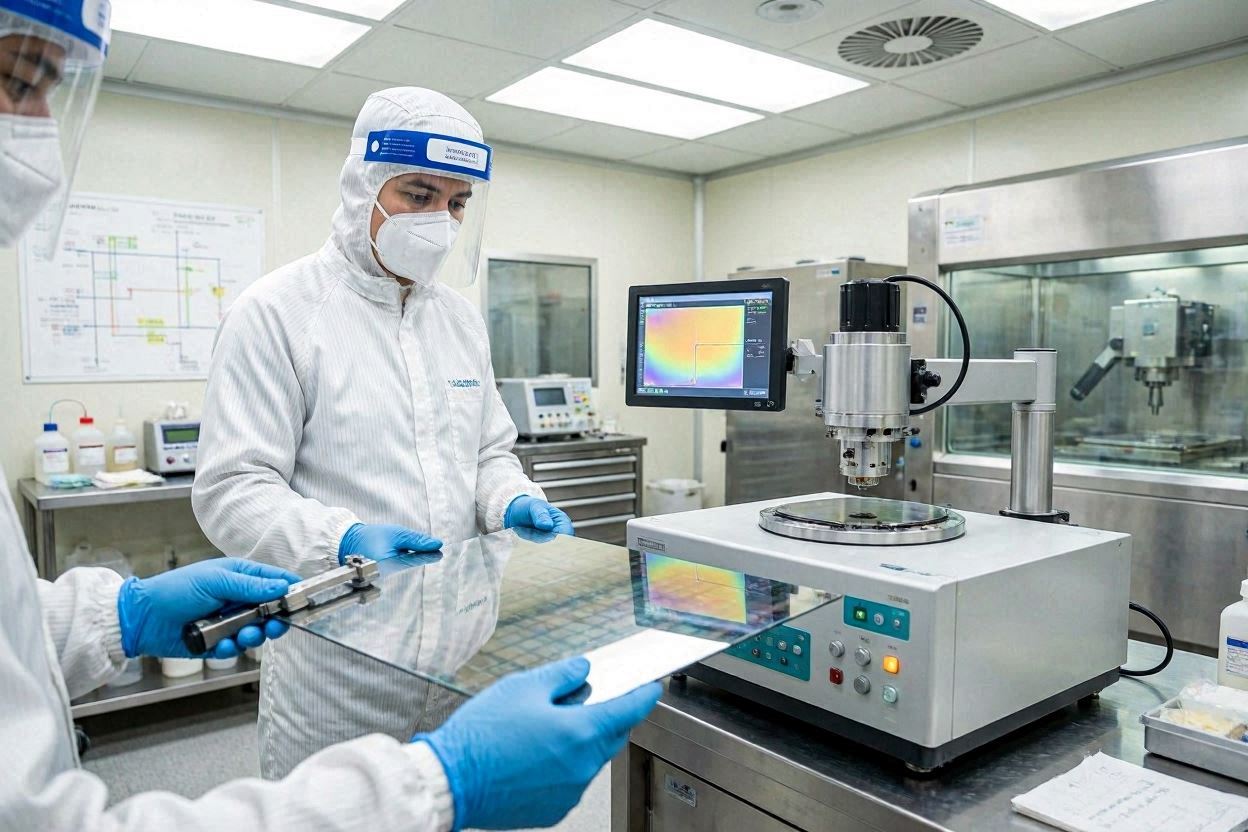
5. Inspection Methods and Equipment Overview
Laser Surface Scanners (KLA, Onto Innovation)
Laser surface inspection tools — the KLA Surfscan SP-series and Onto Innovation systems being the dominant platforms in production fabs — use laser illumination at multiple angles to detect light scattering from surface features (particles, scratches, pits, and surface roughness). They are the standard method for post-CMP defect characterization, providing defect maps that can be analyzed by defect classification algorithms to distinguish scratch defects from random particles.
The sensitivity of laser scanners depends on the wavelength and incidence angle of the illumination. For scratch detection on metal surfaces (post-copper CMP), dark-field oblique illumination provides best contrast. For dielectric surfaces (post-oxide CMP), specular or near-normal illumination may be more sensitive to shallow scratches in the transparent film.
Scanning Electron Microscopy (SEM)
SEM is the standard method for confirming the morphology and dimensions of individual defects identified by laser scanner. At 1,000–50,000× magnification, SEM can distinguish scratch depth and width, characterize particle residue morphology, and identify whether a defect is a surface feature or a subsurface structure. EDX elemental analysis during SEM allows identification of residual abrasive particles by their chemical composition — distinguishing cerium (ceria residue), aluminum (alumina residue), or silicon (silica residue) particles.
Atomic Force Microscopy (AFM)
AFM provides the highest spatial resolution surface topography data, capable of measuring scratch depth in the angstrom range and characterizing surface roughness (Ra, Rq, Rz) at the nanometer scale. AFM is primarily used in process development and qualification contexts rather than for production monitoring — scan speeds are too slow for routine wafer-by-wafer inspection — but it is indispensable for characterizing final surface quality in SiC polishing and silicon wafer finishing applications where sub-nanometer Ra specifications must be verified. For SiC surface quality requirements, see: CMP Slurry for SiC Wafer Polishing.
Transmission Electron Microscopy (TEM) Cross-Section
TEM cross-sectional analysis of scratch defects provides the definitive measurement of scratch depth and subsurface damage extent. This is the most powerful technique for determining whether a scratch is a surface-only feature (removable by additional CMP) or extends deep into the underlying film or device structures (potentially a killer defect regardless of further processing). TEM sample preparation is destructive and labor-intensive, limiting it to root cause investigations rather than routine monitoring.
6. Root Cause Analysis: Linking Defects to Slurry Variables
7. SPC and Monitoring Strategy for CMP Defectivity
A robust statistical process control (SPC) program for post-CMP defectivity is essential for early detection of defect excursions before they propagate to product wafers. The following parameters should be tracked with defined control limits and out-of-control response procedures:
- Incoming slurry LPC (per lot): Measure at goods receipt on every slurry lot. Define a reject threshold (e.g., >100 particles/mL at >1 µm) and a hold-for-reinspection threshold (e.g., 50–100 particles/mL). Track lot-to-lot trend using control charts.
- Post-CMP KLA scan (per wafer or sampled): Monitor total defect count, scratch count, and particle count separately. Apply separate control limits for each defect class. Scratch count should be tracked with an upper control limit and an upper spec limit — UCL triggers investigation, USL triggers hold and root cause analysis before next lot.
- Point-of-use filter differential pressure: Rising ΔP across the POU filter indicates increasing particle loading and approaching end-of-life. Define a ΔP limit for filter replacement to prevent breakthrough. Monitor continuously and track trend.
- Slurry pH at dispense point: Monitor pH at the tool using an inline pH sensor or periodic grab sample measurement. pH drift indicates buffer depletion, contamination, or distribution system issues.
8. How JEEZ Slurry Design Addresses Defect Control
Defect reduction is a primary design objective in JEEZ’s CMP slurry formulation program, not an afterthought. Our approach to defect-relevant slurry properties includes:
Tight particle size distribution control: We specify our abrasive particle synthesis and blending processes to achieve narrow D50/D90/D99 distributions. Our manufacturing QC includes LPC measurement on every production lot before release, with reject criteria that are tighter than typical customer incoming specifications — providing a quality buffer against lot-to-lot variation.
Dispersion stability engineering: All JEEZ slurries are formulated with dispersant and surfactant packages designed to maintain zeta potential within the stable range (|ζ| > 30 mV) across the specified pH and temperature window. Stability is verified by accelerated aging tests (45°C for 14 days) as part of lot release qualification.
Application engineering support for defect investigations: When customers experience post-CMP defect excursions, our application engineers actively participate in root cause analysis — reviewing slurry CoA data, distribution system configurations, and KLA inspection maps together with the customer’s process team. We treat defect excursions as shared problems rather than supplier/customer disputes.
For guidance on selecting a low-defectivity slurry for your specific application, see our selection guide: How to Choose a CMP Slurry: Selection Guide for Semiconductor Engineers. For our full manufacturer overview, see: Top CMP Slurry Manufacturers: Global Supplier Guide 2026.
Experiencing Post-CMP Defect Issues?
JEEZ application engineers can help you diagnose the root cause and evaluate whether a slurry change is part of the solution. Contact us with your KLA data, CoA information, and process parameters for a technical consultation.
Contact Our Experts →